Sol-klima-teorien
 Denne artikel bør gennemlæses af en person med fagkendskab for at sikre den faglige korrekthed.
Sol-klima-teorien er en teori om solens påvirkning af jordens klima, blandt andet i forbindelse med global opvarmning. Danmarks Meteorologiske Institut og Dansk Rumcenter er nogle af de vigtigste bidragydere til forskningen i disse emner. En kendt forsker på området og fortaler for sol-klima-teorien er astrofysikeren Henrik Svensmark.
Jordens klima er i høj grad afhængigt af solens indstråling, men sol-klima-spørgsmålet drejer sig om, hvorvidt ændringer i jordens klima primært skyldes ændringer i solens aktivitet.
Der skelnes mellem indre og ydre klimapåvirkninger. Til de vigtigste ydre årsager hører solens indflydelse og indflydelsen fra vulkanisme, idet svovl fra vulkaner kan ende i den øverste atmosfære, hvor det i nogle år afkøler jordens klima ved at reflektere solens stråler. Hvis solens indflydelse er variabel, kan man forvente at spore indflydelsen på f.eks. jordens middeltemperatur. Mekanismerne, hvorved solen kan indvirke på klimaet, omfatter variationer i solindstrålingen, men også andre mekanismer, som ikke er relateret til sollyset selv.
Sol-klima-teorien er, ligesom andre klimateorier, politisk kontroversiel, da teorierne spiller en stor rolle for hvordan man skal forholde sig til global opvarmning.
Selv de danske solforskere erkendt at de globale temperatur stigninger i det mindste siden ca. 1980 ikke hænger sammen med ændret sol aktivitet. [1]
Se også
Noter
| |||||||||||||||||||||||||||||||||||||||||||||||||||||||||||
Medier brugt på denne side
Forfatter/Opretter: Femkemilene, Licens: CC BY-SA 4.0
The five components of the climate system.
The figure is made using Visme, with all photos from unsplash, which has a free to use copyright. Higher quality unfortunately only available with paid version.
Specifically on https://unsplash.com/license: All photos published on Unsplash can be used for free. You can use them for commercial and noncommercial purposes. You do not need to ask permission from or provide credit to the photographer or Unsplash, although it is appreciated when possible.
More precisely, Unsplash grants you an irrevocable, nonexclusive, worldwide copyright license to download, copy, modify, distribute, perform, and use photos from Unsplash for free, including for commercial purposes, without permission from or attributing the photographer or Unsplash. This license does not include the right to compile photos from Unsplash to replicate a similar or competing service.Forfatter/Opretter: Finn Bjørklid, Licens: CC BY-SA 3.0
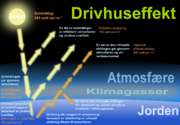
Diagram shows how the greenhouse effect works. Norwegian text. Translation of "The green house effect.svg" on Commons
Forfatter/Opretter: Oeneis, translation by Dymetrios, Licens: CC BY-SA 4.0
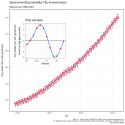
This figure shows the history of atmospheric carbon dioxide concentrations as directly measured at Mauna Loa, Hawaii since 1958. This curve is known as the Keeling curve, and is an essential piece of evidence of the man-made increases in greenhouse gases that are believed to be the cause of global warming. The longest such record exists at Mauna Loa, but these measurements have been independently confirmed at many other sites around the world [1]. The annual fluctuation in carbon dioxide is caused by seasonal variations in carbon dioxide uptake by land plants. Since many more forests are concentrated in the Northern Hemisphere, more carbon dioxide is removed from the atmosphere during Northern Hemisphere summer than Southern Hemisphere summer. This annual cycle is shown in the inset figure by taking the average concentration for each month across all measured years. The red curve shows the average monthly concentrations, and blue curve is a smoothed trend. The carbon dioxide data is measured as the mole fraction in dry air. This dataset constitutes the longest record of direct measurements of CO2 in the atmosphere (data up to december 2018).
Forfatter/Opretter: Robert A. Rohde, Licens: CC BY-SA 3.0
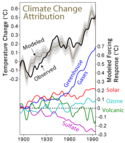
See extending Description below


