National Hockey League 2021-22
| National Hockey League | |
|---|---|
| Sæson | 2021-22 |
| Sæson nr. | 105 |
| Periode | 12. oktober 2021 - 26. juni 2022 |
| Mester | Colorado Avalanche |
| Andenplads | Tampa Bay Lightning |
| Antal hold | 32 hold |
| National Hockey League | |
National Hockey League 2021-22 var den 105. sæson (og den 104. sæson med spil) af ishockeyligaen National Hockey League. Ligaen havde deltagelse af 32 hold, eftersom den siden den foregående sæson var blevet udvidet med et nyt hold, Seattle Kraken. Turneringen blev indledt med et grundspil, hvor hvert hold spillede 82 kampe, og hvorfra 16 hold gik videre til slutspillet om Stanley Cup.
Slutspillet om Stanley Cup blev vundet af Colorado Avalanche, som i finalen besejrede de forsvarende mestre, Tampa Bay Lightning, med 4-2 i kampe. Den afgørende kamp blev spillet den 26. juni 2022 i Tampa, hvor Colorado Avalanche vandt den sjette kamp i finaleserien med 2-1. Sejrsmålet til 2-1 blev scoret efter 12:28 i anden periode af Artturi Lehkonen. Colorado Avalanche vandt dermed Stanley Cup for tredje gang i klubbens historie og for første gang siden 2001. Tampa Bay var i Stanley Cup-finalen for tredje sæson i træk og havde vundet titlen de to foregående sæsoner.
Mesterholdets back Cale Makar vandt Conn Smythe Trophy som slutspillets mest værdifulde spiller, efter at være sluttet på tredjepladsen på slutspillets topscorerliste med 29 point (8 mål og 21 assister) i 20 kampe.[1]
Hold
Holdene var inddelt i to konferencer med 16 hold hver. Hver konference var yderligere inddelt i to divisioner med syv eller otte hold i hver division.
Danske spillere
 Tekst mangler, hjælp os med at skrive teksten
Grundspil
| National Hockey League Grundspil | |
|---|---|
| Periode | 12. oktober 2021 - 1. maj 2022 |
| Antal hold | 32 hold |
| Kampe spillet | 1312 |
| Totalt antal mål | 8.252 (6,29 pr. kamp) |
| Topscorer | Connor McDavid, Edmonton 123 point (44 mål, 79 assister) |
| Største hjemmesejr | 9 mål Pittsburgh - Detroit (11-2) 27. marts 2022 |
| Største udesejr | 8 mål San Jose - Nashville (0-8) 5. marts 2022 |
| Største antal mål | 17 mål Detroit - Toronto (7-10) 26. februar 2022 |
Format
Alle hold spillede 82 grundspilskampe (41 hjemme- og 41 udekampe).
De tre bedste hold i hver division gik videre til slutspillet om Stanley Cup, sammen med de to bedste hold i hver konference, der var placeret uden for top 3 i deres respektive division.
Udendørskampe
Tre af grundspilskampene bliver spillet udendørs:
- NHL Winter Classic blev afviklet den 1. januar 2022 på Target Field i Minneapolis, Minnesota, hvor Minnesota Wild tabte med 4-6 til St. Louis Blues.
- NHL Stadium Series blev spillet den 26. februar 2022 på Nissan Stadium i Nashville, Tennessee, hvor Nashville Predators tabte med 2-3 til Tampa Bay Lightning.
- NHL Heritage Classic blev spillet den 13. marts 2022 på Tim Hortons Field i Hamilton, Ontario, hvor Buffalo Sabres vandt over Toronto Maple Leafs med 5-2.
All-star-kamp
NHL all star-kampen blev afholdt i T-Mobile Arena i Las Vegas, Nevada den 5. februar 2022, hvor Metropolitan Division i finalen besejrede Central Division med 5-3.
Østkonferencen
Metropolitan Division
K: Spillede kampe, V: Kampe vundet (2 point), TO: Kampe tabt efter overtid/straffeslag (1 point), T: Kampe tabt i ordinær spilletid (0 point), |
Atlantic Division
K: Spillede kampe, V: Kampe vundet (2 point), TO: Kampe tabt efter overtid/straffeslag (1 point), T: Kampe tabt i ordinær spilletid (0 point), |
Vestkonferencen
Central Division
K: Spillede kampe, V: Kampe vundet (2 point), TO: Kampe tabt efter overtid/straffeslag (1 point), T: Kampe tabt i ordinær spilletid (0 point), |
Pacific Division
K: Spillede kampe, V: Kampe vundet (2 point), TO: Kampe tabt efter overtid/straffeslag (1 point), T: Kampe tabt i ordinær spilletid (0 point), |
Slutspil
| National Hockey League Slutspil | |
|---|---|
| Periode | 2. maj - . juni 2020 |
| Antal hold | 16 hold |
| Kampe spillet | 88 |
| Totalt antal mål | 561 (6,38 pr. kamp) |
| Topscorer | Connor McDavid, Edmonton Oilers 33 point (10 mål, 23 assister) |
| Største hjemmesejr | 7 mål Colorado - Tampa Bay (7-0) 18. juni 2022 |
| Største udesejr | 6 mål Los Angeles - Edmonton (2-8) 6. maj 2022 |
| Største antal mål | 15 mål Calgary - Edmonton (9-6) 18. maj 2022 |
Hold og seedninger
Slutspillet om Stanley Cup havde deltagelse af 16 hold – 8 fra østkonferencen og 8 fra vestkonferencen.
Format
I de første to runder var slutspillet primært opdelt i henhold til grundspilsdivisionerne.
Alle opgør spilledes bedst af syv kampe, hvor det højst seedede hold havde hjemmebane i kamp 1, 2, 5 og 7, mens det lavest seedede hold spillede hjemme i kamp 3, 4 og 6. Uafgjorte kampe blev afgjort i forlænget spilletid til først scorede mål i perioder a 20 minutter med fem markspillere på hvert hold.
Skema
| Første runde | Anden runde | Konferencefinaler | Stanley Cup-finale | |||||||||||||||
| A1 | Florida Panthers | 4 | ||||||||||||||||
| WC | Washington Capitals | 2 | ||||||||||||||||
| A1 | Florida Panthers | 0 | ||||||||||||||||
| Atlantic | ||||||||||||||||||
| A3 | Tampa Bay Lightning | 4 | ||||||||||||||||
| A2 | Toronto Maple Leafs | 3 | ||||||||||||||||
| A3 | Tampa Bay Lightning | 4 | ||||||||||||||||
| A3 | Tampa Bay Lightning | 4 | ||||||||||||||||
| Østkonferencen | ||||||||||||||||||
| M2 | New York Rangers | 2 | ||||||||||||||||
| M1 | Carolina Hurricanes | 4 | ||||||||||||||||
| WC | Boston Bruins | 3 | ||||||||||||||||
| M1 | Carolina Hurricanes | 3 | ||||||||||||||||
| Metropolitan | ||||||||||||||||||
| M2 | New York Rangers | 4 | ||||||||||||||||
| M2 | New York Rangers | 4 | ||||||||||||||||
| M3 | Pittsburgh Penguins | 3 | ||||||||||||||||
| A3 | Tampa Bay Lightning | 2 | ||||||||||||||||
| C1 | Colorado Avalanche | 4 | ||||||||||||||||
| C1 | Colorado Avalanche | 4 | ||||||||||||||||
| WC | Nashville Predators | 0 | ||||||||||||||||
| C1 | Colorado Avalanche | 4 | ||||||||||||||||
| Central | ||||||||||||||||||
| C3 | St. Louis Blues | 2 | ||||||||||||||||
| C2 | Minnesota Wild | 2 | ||||||||||||||||
| C3 | St. Louis Blues | 4 | ||||||||||||||||
| C1 | Colorado Avalanche | 4 | ||||||||||||||||
| Vestkonferencen | ||||||||||||||||||
| P2 | Edmonton Oilers | 0 | ||||||||||||||||
| P1 | Calgary Flames | 4 | ||||||||||||||||
| WC | Dallas Stars | 3 | ||||||||||||||||
| P1 | Calgary Flames | 1 | ||||||||||||||||
| Pacific | ||||||||||||||||||
| P2 | Edmonton Oilers | 4 | ||||||||||||||||
| P2 | Edmonton Oilers | 4 | ||||||||||||||||
| P3 | Los Angeles Kings | 3 | ||||||||||||||||
Første runde
Østkonferencen
| Florida Panthers (A1) − Washington Capitals (WC2)4–2 | |||||||||||||||||||||||||||||||||||||||||||||||||||||||||||||||
|---|---|---|---|---|---|---|---|---|---|---|---|---|---|---|---|---|---|---|---|---|---|---|---|---|---|---|---|---|---|---|---|---|---|---|---|---|---|---|---|---|---|---|---|---|---|---|---|---|---|---|---|---|---|---|---|---|---|---|---|---|---|---|---|
|
| Toronto Maple Leafs (A2) − Tampa Bay Lightning (A3)3–4 | ||||||||||||||||||||||||||||||||||||||||||||||||||||||||||||||||||||||||
|---|---|---|---|---|---|---|---|---|---|---|---|---|---|---|---|---|---|---|---|---|---|---|---|---|---|---|---|---|---|---|---|---|---|---|---|---|---|---|---|---|---|---|---|---|---|---|---|---|---|---|---|---|---|---|---|---|---|---|---|---|---|---|---|---|---|---|---|---|---|---|---|---|
|
| Carolina Hurricanes (M1) − Boston Bruins (WC1)4–3 | ||||||||||||||||||||||||||||||||||||||||||||||||||||||||||||||||||||||||
|---|---|---|---|---|---|---|---|---|---|---|---|---|---|---|---|---|---|---|---|---|---|---|---|---|---|---|---|---|---|---|---|---|---|---|---|---|---|---|---|---|---|---|---|---|---|---|---|---|---|---|---|---|---|---|---|---|---|---|---|---|---|---|---|---|---|---|---|---|---|---|---|---|
|
| New York Rangers (M2) − Pittsburgh Penguins (M3)4–3 | ||||||||||||||||||||||||||||||||||||||||||||||||||||||||||||||||||||||||
|---|---|---|---|---|---|---|---|---|---|---|---|---|---|---|---|---|---|---|---|---|---|---|---|---|---|---|---|---|---|---|---|---|---|---|---|---|---|---|---|---|---|---|---|---|---|---|---|---|---|---|---|---|---|---|---|---|---|---|---|---|---|---|---|---|---|---|---|---|---|---|---|---|
|
Vestkonferencen
| Colorado Avalanche (C1) − Nashville Predators (WC2)4–0 | |||||||||||||||||||||||||||||||||||||||||||||
|---|---|---|---|---|---|---|---|---|---|---|---|---|---|---|---|---|---|---|---|---|---|---|---|---|---|---|---|---|---|---|---|---|---|---|---|---|---|---|---|---|---|---|---|---|---|
|
| Minnesota Wild (C2) − St. Louis Blues (C3)2–4 | |||||||||||||||||||||||||||||||||||||||||||||||||||||||||||||||
|---|---|---|---|---|---|---|---|---|---|---|---|---|---|---|---|---|---|---|---|---|---|---|---|---|---|---|---|---|---|---|---|---|---|---|---|---|---|---|---|---|---|---|---|---|---|---|---|---|---|---|---|---|---|---|---|---|---|---|---|---|---|---|---|
|
| Calgary Flames (P1) − Dallas Stars (WC1)4–3 | ||||||||||||||||||||||||||||||||||||||||||||||||||||||||||||||||||||||||
|---|---|---|---|---|---|---|---|---|---|---|---|---|---|---|---|---|---|---|---|---|---|---|---|---|---|---|---|---|---|---|---|---|---|---|---|---|---|---|---|---|---|---|---|---|---|---|---|---|---|---|---|---|---|---|---|---|---|---|---|---|---|---|---|---|---|---|---|---|---|---|---|---|
|
| Edmonton Oilers (P2) − Los Angeles Kings (P3)4–3 | ||||||||||||||||||||||||||||||||||||||||||||||||||||||||||||||||||||||||
|---|---|---|---|---|---|---|---|---|---|---|---|---|---|---|---|---|---|---|---|---|---|---|---|---|---|---|---|---|---|---|---|---|---|---|---|---|---|---|---|---|---|---|---|---|---|---|---|---|---|---|---|---|---|---|---|---|---|---|---|---|---|---|---|---|---|---|---|---|---|---|---|---|
|
Anden runde
Østkonferencen
| Florida Panthers (A1) − Tampa Bay Lightning (A3)0–4 | |||||||||||||||||||||||||||||||||||||||||||||
|---|---|---|---|---|---|---|---|---|---|---|---|---|---|---|---|---|---|---|---|---|---|---|---|---|---|---|---|---|---|---|---|---|---|---|---|---|---|---|---|---|---|---|---|---|---|
|
| Carolina Hurricanes (M1) − New York Rangers (M2)3–4 | ||||||||||||||||||||||||||||||||||||||||||||||||||||||||||||||||||||||||
|---|---|---|---|---|---|---|---|---|---|---|---|---|---|---|---|---|---|---|---|---|---|---|---|---|---|---|---|---|---|---|---|---|---|---|---|---|---|---|---|---|---|---|---|---|---|---|---|---|---|---|---|---|---|---|---|---|---|---|---|---|---|---|---|---|---|---|---|---|---|---|---|---|
|
Vestkonferencen
| Colorado Avalanche (C1) − St. Louis Blues (C3)4–2 | |||||||||||||||||||||||||||||||||||||||||||||||||||||||||||||||
|---|---|---|---|---|---|---|---|---|---|---|---|---|---|---|---|---|---|---|---|---|---|---|---|---|---|---|---|---|---|---|---|---|---|---|---|---|---|---|---|---|---|---|---|---|---|---|---|---|---|---|---|---|---|---|---|---|---|---|---|---|---|---|---|
|
| Calgary Flames (P1) − Edmonton Oilers (P2)1–4 | ||||||||||||||||||||||||||||||||||||||||||||||||||||||
|---|---|---|---|---|---|---|---|---|---|---|---|---|---|---|---|---|---|---|---|---|---|---|---|---|---|---|---|---|---|---|---|---|---|---|---|---|---|---|---|---|---|---|---|---|---|---|---|---|---|---|---|---|---|---|
|
Konferencefinaler
Østkonferencen
| New York Rangers (M2) − Tampa Bay Lightning (A3)2–4 | |||||||||||||||||||||||||||||||||||||||||||||||||||||||||||||||
|---|---|---|---|---|---|---|---|---|---|---|---|---|---|---|---|---|---|---|---|---|---|---|---|---|---|---|---|---|---|---|---|---|---|---|---|---|---|---|---|---|---|---|---|---|---|---|---|---|---|---|---|---|---|---|---|---|---|---|---|---|---|---|---|
|
Vestkonferencen
| Colorado Avalanche (C1) − Edmonton Oilers (P2)4–0 | |||||||||||||||||||||||||||||||||||||||||||||
|---|---|---|---|---|---|---|---|---|---|---|---|---|---|---|---|---|---|---|---|---|---|---|---|---|---|---|---|---|---|---|---|---|---|---|---|---|---|---|---|---|---|---|---|---|---|
|
Stanley Cup-finale
| Colorado Avalanche (C1) − Tampa Bay Lightning (A3)4–2 | |||||||||||||||||||||||||||||||||||||||||||||||||||||||||||||||
|---|---|---|---|---|---|---|---|---|---|---|---|---|---|---|---|---|---|---|---|---|---|---|---|---|---|---|---|---|---|---|---|---|---|---|---|---|---|---|---|---|---|---|---|---|---|---|---|---|---|---|---|---|---|---|---|---|---|---|---|---|---|---|---|
|
Kilder / eksterne henvisninger
- National Hockey League (engelsk)
Noter
Medier brugt på denne side
arrow l

|
A raster version of this image is available. It should be used in place of this vector image when superior.
File:Arrow l.svg → File:Arr l.png
In general, it is better to use a good SVG version. |
arrow r

|
A raster version of this image is available. It should be used in place of this vector image when superior.
File:Arrow r.svg → File:Arr r.png
In general, it is better to use a good SVG version. |
Flag of the United States. Aspect ratio modified (stretched) for projects that require 3:2 format.
Flag of Canada using Pantone colors. Aspect ratio modified for projects that require an aspect ratio of 3:2.
Forfatter/Opretter: Uwe Dedering, Licens: CC BY-SA 3.0
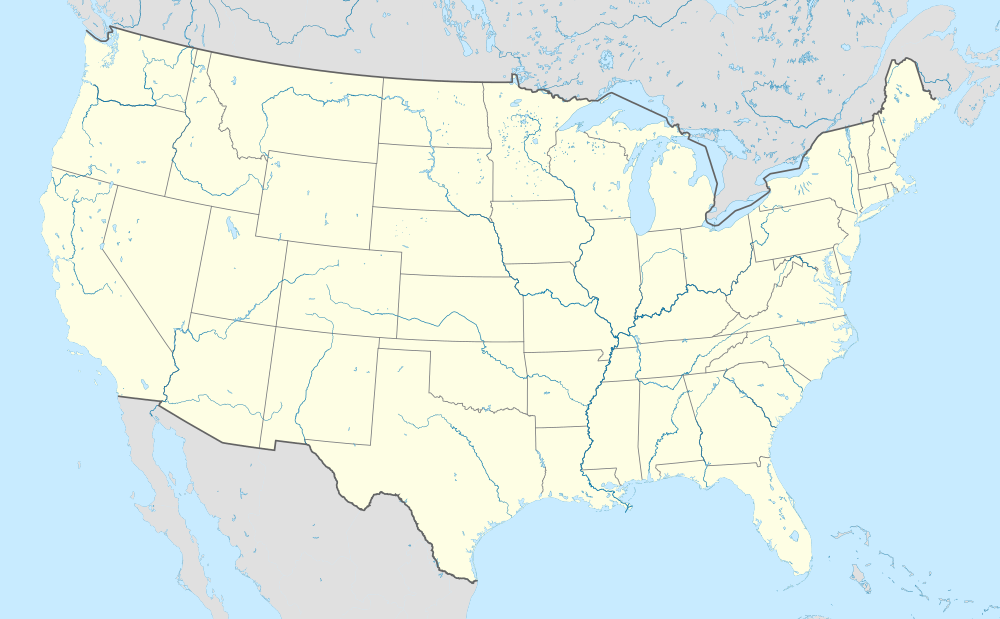
Location map of the USA (without Hawaii and Alaska).
EquiDistantConicProjection:
Central parallel:
* N: 37.0° N
Central meridian:
* E: 96.0° W
Standard parallels:
* 1: 32.0° N
* 2: 42.0° N
Made with Natural Earth. Free vector and raster map data @ naturalearthdata.com.
Formulas for x and y:
x = 50.0 + 124.03149777329222 * ((1.9694462586094064-({{{2}}}* pi / 180))
      * sin(0.6010514667026994 * ({{{3}}} + 96) * pi / 180))
y = 50.0 + 1.6155950752393982 * 124.03149777329222 * 0.02613325650382181
      - 1.6155950752393982  * 124.03149777329222 *
     (1.3236744353715044  - (1.9694462586094064-({{{2}}}* pi / 180))
      * cos(0.6010514667026994 * ({{{3}}} + 96) * pi / 180))
Another color for the “ButtonColor.svg” series with black outlines and specular highlight in the center:
See below.
Another color for the “ButtonColor.svg” series with black outlines and specular highlight in the center:
Another color for the “ButtonColor.svg” series with black outlines and specular highlight in the center:
Another color for the “ButtonColor.svg” series with black outlines and specular highlight in the center:


