Klimatologi

Klimatologi er læren om klimaet.[1]
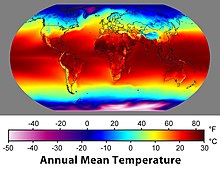
Klimatologiens opgave er at beskrive og forklare sådanne fysiske egenskaber i atmosfæren som temperatur, vinde og nedbør samt deres fordeling efter område og sted.
Friedrich Wilhelm Heinrich Alexander von Humboldt regnes som grundlægger af den sammenlignende klimatologi, idet han var den første, som lavede isotermer på grundlag af et stort antal temperaturmålinger[2].
Noter
Eksterne henvisninger
- Salmonsens Konversationsleksikon, 2. udgave, bind XI (1921), s. 855
- Salmonsens Konversationsleksikon, 2. udgave, bind XIV (1923), s. 125
Se også
| |||||||||||||||||||||||||||||||||||||||||||||||||||||||||||
| Spire Denne artikel om klima og klimaforandringer er en spire som bør udbygges. Du er velkommen til at hjælpe Wikipedia ved at udvide den. |
|
Medier brugt på denne side
Forfatter/Opretter: Femkemilene, Licens: CC BY-SA 4.0
The five components of the climate system.
The figure is made using Visme, with all photos from unsplash, which has a free to use copyright. Higher quality unfortunately only available with paid version.
Specifically on https://unsplash.com/license: All photos published on Unsplash can be used for free. You can use them for commercial and noncommercial purposes. You do not need to ask permission from or provide credit to the photographer or Unsplash, although it is appreciated when possible.
More precisely, Unsplash grants you an irrevocable, nonexclusive, worldwide copyright license to download, copy, modify, distribute, perform, and use photos from Unsplash for free, including for commercial purposes, without permission from or attributing the photographer or Unsplash. This license does not include the right to compile photos from Unsplash to replicate a similar or competing service.Forfatter/Opretter: Robert A. Rohde, Licens: CC BY-SA 3.0
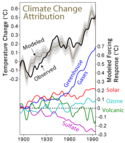
See extending Description below
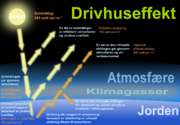
Forfatter/Opretter: Finn Bjørklid, Licens: CC BY-SA 3.0
Diagram shows how the greenhouse effect works. Norwegian text. Translation of "The green house effect.svg" on Commons
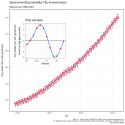
Forfatter/Opretter: Oeneis, translation by Dymetrios, Licens: CC BY-SA 4.0
This figure shows the history of atmospheric carbon dioxide concentrations as directly measured at Mauna Loa, Hawaii since 1958. This curve is known as the Keeling curve, and is an essential piece of evidence of the man-made increases in greenhouse gases that are believed to be the cause of global warming. The longest such record exists at Mauna Loa, but these measurements have been independently confirmed at many other sites around the world [1]. The annual fluctuation in carbon dioxide is caused by seasonal variations in carbon dioxide uptake by land plants. Since many more forests are concentrated in the Northern Hemisphere, more carbon dioxide is removed from the atmosphere during Northern Hemisphere summer than Southern Hemisphere summer. This annual cycle is shown in the inset figure by taking the average concentration for each month across all measured years. The red curve shows the average monthly concentrations, and blue curve is a smoothed trend. The carbon dioxide data is measured as the mole fraction in dry air. This dataset constitutes the longest record of direct measurements of CO2 in the atmosphere (data up to december 2018).
Before the year 2004, only two tropical cyclones had ever been noted in the South Atlantic Basin, and no hurricane. However, a circulation center well off the coast of southern Brazil developed tropical cyclone characteristics and continued to intensify as it moved westward. The system developed an eye and apparently reached hurricane strength on Friday, March 26, before eventually making landfall late on Saturday, March 27, 2004.
The crew of the International Space Station was notified of the cyclone and acquired excellent photographs of the storm just as it made landfall on the southern Brazilian state of Santa Catarina (the storm has been unofficially dubbed “Cyclone Catarina”). Note the clockwise circulation of Southern Hemisphere cyclones, the well-defined banding features, and the eyewall of at least a Category 1 system. The coastline is visible under the clouds in the upper left corner of the image.


