Jordens atmosfære
 | |
| Atmosfærens luftarter | |
| Nitrogen | 78,0842% |
| Oxygen | 20,9463% |
| Argon | 0,93422% |
| Kuldioxid (CO2) | 0,03811% |
| Vanddamp | 0–4% (gennemsnitlig 1%) |
| Andre luftarter | 0,002% |
Jordens atmosfære består af forskellige luftarter, inklusiv vand i gasfase som vanddamp og vand i dråber eller som iskrystaller. Herudover indeholder atmosfæren også små mængder bioaerosoler (fx pollen og bakterie-, svampe- og algesporer), og efter vulkanudbrud kan atmosfæren indeholde vulkansk aske - i mængder der kan standse lufttrafik.
Atmosfærens virkning
Atmosfæren beskytter livet på jorden ved at absorbere solens ultraviolette stråler (al UVC og næsten al UVB), forstøve meteorer, forstøve kometer, absorbere solvind og kosmisk stråling.[1][2][3] Herudover reducerer atmosfæren temperaturforskellene mellem nat og dag samt udligner globalt set temperaturforskellene mellem områder med relativt indstrålingsoverskud, subtroperne og troperne, og områder med relativt indstrålingsunderskud, de polare egne arktis og antarktis. Det sker mest ved at atmosfæren transporterer store mængder vand, der er fordampet fra oceanerne i de tropiske og subtropiske zoner og som præcipiterer som regn eller sne andre steder på kloden. Dette kaldes den atmosfæriske cirkulation. Der transporteres så meget vand i atmosfæren at man i 2015 begyndte at tale om "atmosfæriske floder".[4]
Atmosfærens opbygning
Temperaturen i jordens atmosfære varierer med højden over havoverfladen. Her er beskrivelser af atmosfærens lag [5][6][7]:
- Magnetosfære – ca. 5000 til mere end 60.000 km, regionen hvor Jordens magnetfelt vekselvirker med den såkaldte solvind. Magnetosfæren strækker sig titusindvis af kilometer ud i rummet og med en lang hale væk fra solen. Geostationære satellitter befinder sig i ca. 36.000 km højde over ækvator.
- Ydre Van Allen strålingsbælte – ca. 10.000 – 65.000 km, regioner hvor solens partikler bliver koncentreret.
| Lagdelingen af Jordens atmosfære. | ||||||||||||||||||||||||||
|---|---|---|---|---|---|---|---|---|---|---|---|---|---|---|---|---|---|---|---|---|---|---|---|---|---|---|
| ||||||||||||||||||||||||||
- Exosfære – ca. 700 – 5000 km, hvor atmosfæren tynder ud til rummet.
- Indre Van Allen strålingsbælte – ca. 650 – 6.300 km, regioner hvor solens partikler bliver koncentreret.
- Termosfære – 80/85 – 640+ km, temperaturen stiger med højden.
- Ionosfære – regionen indeholder ioner og kan faktisk betegnes som atmosfærens plasmaskjold. Nordlys og sydlys viser sig fra ca. 80 km højde og opefter, i ringformede områder ca. 17° fra de magnetiske poler, hvor de nedbremsede partikler fra Van Allen strålingsbælterne "afleveres". Ionosfæren kan underopdeles i[8][9]:
- F2-lag (>150 km)
- F1-lag (>180km)
- E-lag (95-150 km)
- D-lag (75-90 km)
- Ionosfære – regionen indeholder ioner og kan faktisk betegnes som atmosfærens plasmaskjold. Nordlys og sydlys viser sig fra ca. 80 km højde og opefter, i ringformede områder ca. 17° fra de magnetiske poler, hvor de nedbremsede partikler fra Van Allen strålingsbælterne "afleveres". Ionosfæren kan underopdeles i[8][9]:
- Mesopause – Regiongrænse.
- Mesosfære – 50 – 80/85 km, temperaturen falder med højden.
- Stratopause – Regiongrænse.
- Stratosfære – 7/17 – 50 km, temperaturen stiger typisk med højden på grund af opfangen ultraviolet stråling (al UVC og næsten al UVB) via stratosfærisk ozon.
- Tropopause – Regiongrænse.
- Troposfære (en del af biosfæren) – Ved polerne: 0 – 7 km, ved ækvator 0 – 17 km, temperaturen falder typisk med højden (barometrisk højdeformel). Mere end 80 % af atmosfærens masse er i troposfæren. Det er i troposfæren, at der er turbulens. Det skyldes jordoverfladeujævnheder som f.eks. planter og selve overfladen. Herudover sker der opblanding på grund af lufttransport (vinde og jetstrømme), som forårsages af temperaturforskelle. Langt det meste nedbør er i denne region. Her befinder de fleste skyer sig.
Atmosfærens sammensætning og kemi
Nær jordoverfladen er atmosfærens sammensætning i runde tal således (efter rumfang eller stofmængde)[5]:
- 78,08 % kvælstof (nitrogen)
- 20,95 % ilt (oxygen), denne andel har svinget gennem jordens historie.[10]
- 0,93 % argon
Der er dog også mange andre stoffer, men i meget små mængder, bl.a. methan, ozon, CFC-gasser, svovldioxid og nitrogenilter. Herudover er 0-4 % vanddamp. Gasser med tre eller flere atomer per molekyle virker som drivhusgasser og er årsag til, at Jordens gennemsnitstemperatur er 15 °C, og at livet dermed er muligt på Jorden. Uden drivhuseffekt ville Jordens gennemsnitstemperatur ligge betydeligt lavere på omkring -18 °C.
Atmosfærens og især troposfærens kemi kendes ikke til bunds.[11][12][13] Lyn, mennesker, planter, dyr og mikroorganismer bidrager til komplekse koblede dynamiske kemiske reaktioner i atmosfæren.[14][15][16][17] Mange kemiske reaktioner er ligevægte.[12][18] Både lyn og mindre udladninger i atmosfæren dannes stoffer, fx OH og HO2, som renser luften.[19] I 2025 blev det offentliggjort af forskere fra Monash University, at visse mikrober i jorden fjerner store mængder giftig CO fra atmosfæren, som jordens befolkning tilfører via deres aktiviteter.[20][21]
Galleri
 Illustration af atmosfærens sammensætning.
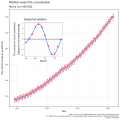 Atmosfærens indhold af kuldioxid (CO2). De månedlige målinger af CO2 viser små sæsonvariationer med en årligt stigende tendens. Hvert års maximum nås i den nordlige halvkugles sene forår, og faldet sker under vækstsæsonen på den nordlige halvkugle, når planterne optager mest CO2 fra atmosfæren.
 Jordens atmosfære indvirker meget på jordens energiligevægt. Langt det meste energi kommer fra Solen og bliver enten oplagret i organisk stof (lille del), noget reflekteres, og meget genudstråles som infrarød varme. Ligevægten mellem indstrålet og udstrålet energi gør, at jordens middeloverfladetemperatur er ca. 17°C. Uden atmosfæren ville jorden være gold ligesom månen.
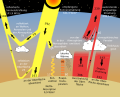 Den termiske ligevægt udtrykt som Watt pr kvadratmeter beregnet som gennemsnit for perioden 2000-2004
 Solens energi, vist som funktion af bølgelængden. Virkningen af atmosfærens filtrering kan ses, da der både er vist bølgelængdefordelingen uden for Jordens atmosfære (rød) og i klart vejr ved havoverfladen (orange/sennepsfarvet). Forskellen skyldes hovedsageligt CO2 og vanddamp. Mennesket kan se bølgelængder mellem ca. 400 nm(indigo)-780 nm(rød).
![De yderste lag af Jordens Atmosfære beskytter mod Kosmisk stråling.[22]. Billedet er en illustration, kosmiske stråler er ikke synlige.](//upload.wikimedia.org/wikipedia/commons/thumb/7/7a/Crshower2_nasa.jpg/120px-Crshower2_nasa.jpg) De yderste lag af Jordens Atmosfære beskytter mod Kosmisk stråling.[22]. Billedet er en illustration, kosmiske stråler er ikke synlige.
De yderste lag af Jordens Atmosfære beskytter mod Kosmisk stråling.[22]. Billedet er en illustration, kosmiske stråler er ikke synlige.

Kilder/referencer
- ^ 2004-11-05, Sciencedaily: Possible Origin Of Cosmic Rays Revealed With Gamma Rays Citat: "...luckily for life on Earth, gamma rays from objects in outer space are stopped by the atmosphere..."
- ^ 31 October, 2003, BBCNews: Solar storm surge 'not over yet' Citat: "...aircraft traversing the north Atlantic were confined to a narrow corridor to minimise radiation exposure...The Sun is really churned up. The timing of two very large X-class flares aimed directly at the Earth, occurring one right after another, is unprecedented..."
- ^ August 25 2005, iol: Meteor dust may affect climate – study Arkiveret 25. juni 2006 hos Wayback Machine Citat: "...Friction with air molecules stripped away the rock, transforming it into a cloud of dust that trailed from 56 to 18 kilometres in altitude..."
- ^ Sky River to Bust Northern California Drought This Week. Livescience
- ^ a b The Earth's Atmosphere
- ^ "The Magnetosphere. Dr. James L. Green". Arkiveret fra originalen 13. oktober 2004. Hentet 10. oktober 2004.
- ^ Earth's Magnetosphere Arkiveret 15. september 2004 hos Wayback Machine Med billeder.
- ^ The Basics of Radio Wave Propagation. Edwin C. Jones, MD, PhD (AE4TM). Department of Physics and Astronomy, University of Tennessee, Knoxville, TN 37996-1200 Citat: "...Ionosphere: A collection of ionized particles and electrons in the uppermost portion of the earth's atmosphere which is formed by the interaction of the solar wind with the very thin air particles that have escaped the earth's gravity..."
- ^ US Navy: Propagation of Waves Se figur 15 og teksten omkring.
- ^ 29 September 2005, Science Now: Breathing Easier Since the Jurassic Arkiveret 30. oktober 2005 hos Wayback Machine Citat: "...Atmospheric oxygen levels have fluctuated throughout Earth's history..."
- ^ DMI: Hvad er Nordlys ? Arkiveret 14. november 2003 hos Wayback Machine Citat: "...Mange af de forekommende henfalds-processer er komplicerede foto-kemiske reaktioner...Trods de mange års forskning er processerne, der fører til dannelsen af nordlys, endnu ikke fuldt belyst..."
- ^ a b Webarchive backup: January 2000, Harvard University: The Oxidizing Power of the Atmosphere
- ^ Webarchive backup: Centre for Atmospheric Chemistry (CAC): What is Atmospheric Chemistry?
- ^ Max Planck Society (2004, February 26). Astonishing Discovery Over The Amazonian Rain Forest. ScienceDaily Citat: "...natural aerosols from the Amazonian rain forest, and has found that they contained two previously unknown compounds, which are photooxidation products of isoprene. These compounds are hygroscopic and could impact cloud formation, rainfall and climate..."
- ^ Penn State (2004, May 6). Missing Chemical Important To Air Pollution Estimates. ScienceDaily Citat: "..."We think we measured all major components of the hydroxyl radical reactants, but there is something still unaccounted for,” says Brune. "We know that something we cannot identify is reacting with the hydroxyl radicals and we know it is temperature dependent and not light dependent. We just do not know what itis."..."
- ^ American Society for Horticultural Science (2009, September 6). Indoor Plants Found To Release Volatile Organic Compounds. ScienceDaily Citat: "...The study concluded that "while ornamental plants are known to remove certain VOCs, they also emit a variety of VOCs, some of which are known to be biologically active. The longevity of these compounds has not been adequately studied, and the impact of these compounds on humans is unknown."..."
- ^ NASA/Goddard Space Flight Center (2004, July 14). When Sun's Too Strong, Plankton Make Clouds. ScienceDaily Citat: "..."There is the potential that this cycle could slow global warming," said Siegel. "But right now we have no idea of the size of it or even what it means."..."
- ^ ScienceDaily, 2003-03-20: Surprise! Lightning Has Big Effect On Atmospheric Chemistry
- ^ Penn State. (2021, April 29). Lightning and subvisible discharges produce molecules that clean the atmosphere. ScienceDaily Citat: "...Now, a team of atmospheric chemists and lightning scientists have found that lightning bolts and, surprisingly, subvisible discharges that cannot be seen by cameras or the naked eye produce extreme amounts of the hydroxyl radical -- OH -- and hydroperoxyl radical -- HO2..."
- ^ Artikelomtale: January 31, 2025, scitechdaily.com: New Research Reveals How Microbes Help Detoxify Our Atmosphere. Microbes consume large amounts of carbon monoxide using a specialized enzyme, helping regulate atmospheric CO levels Citat: "...“This enzyme is used by trillions of microbes in our soils and waters. These microbes consume CO for their own survival, but in the process inadvertently help us,” Ms Kropp said...“These microbes help clean our atmosphere,” Dr Gillett said. “This counteracts air pollution, which kills many millions of people each year, and also reduces global warming given CO is indirectly a greenhouse gas.”...“Microbes play countless roles essential for both human and planetary health. Yet, because they’re invisible and often misunderstood, their contributions frequently go unnoticed,” he said..."
- ^ Open access: “Quinone extraction drives atmospheric carbon monoxide oxidation in bacteria” by Ashleigh Kropp, David L. Gillett, Hari Venugopal, Miguel A. Gonzálvez, James P. Lingford, Surbhi Jain, Christopher K. Barlow, Jie Zhang, Chris Greening and Rhys Grinter, 29 January 2025, Nature Chemical Biology, backup Citat: "...Diverse bacteria and archaea use atmospheric CO as an energy source for long-term survival...CO is both a potent poison of multicellular life and a high-energy fuel and carbon source for microorganisms...Microbial consumption accounts for an estimated 10–15% of CO removed from the atmosphere (approximately 250 million tons annually)...However, CO provides a supplementary energy source for vast numbers of dormant bacteria present in soils, oceans and other nutrient-deprived environments, allowing them to persist during starvation..."
- ^ Cosmic Rays NASA
- Dieter Heinrich, Manfred Hergt (1992). Munksgaards atlas – økologi. København: Munksgaard. ISBN 87-16-10775-6.
Se også
- Bisol, Halo, Kosmisk stråling
- Meteorologi, Klima, Partialtryk
- Drivhuseffekt, Global opvarmning, Menneskeskabte drivhuseffekt (formodet), Kuldioxid
- Geografi
- Økologi
- Luft, Aerologi
- Den store itlkatastrofe
- Lyn i den øvre atmosfære
Eksterne henvisninger
| Wikimedia Commons har medier relateret til: |
- dk4: Jorden
- 14.08.2003, Ing.dk: Ozonlaget får det bedre (Webside ikke længere tilgængelig)
- Atmospheric Chemistry på Curlie (som bygger videre på Open Directory Project)
| Infoboks uden skabelon Denne artikel har en infoboks dannet af en tabel eller tilsvarende. |
Medier brugt på denne side

Artist's rendition of Earth's magnetosphere.

View of the crescent moon through the top of the Earth's atmosphere. Photographed above 21.5°N, 113.3°E by International Space Station crew Expedition 13 over the South China Sea, just south of Macau (NASA image ID: ISS013-E-54329).

ISS photo taken from shuttle Discovery in August 2005.
Original description: "Backdropped by a colorful Earth, this full view of the International Space Station was photographed from the Space Shuttle Discovery during the STS-114 Return to Flight mission, following the undocking of the two spacecraft." The upper part of the Caspian Sea is visible in the background (the Volga delta is the dark area in the lower right.
Editing: Brightness and contrast was enhanced, saved 85% JPEG.

Abb.A zeigt ein Meteor-Ereignis das als Feuerkugel oder Bolide bezeichnet wird und man erkennt die beiden Plasmaphasen Abb.B ist ein zerschlagener Meteoroid in der letzten Flugphase als Bolide oder Feuerkugel

Forfatter/Opretter:
- original: User:Henrysalome
- this version: MG**** @@@-fr
Artist’s impression of an Air France Concorde in flight.

Forfatter/Opretter: Eric Rolph at English Wikipedia, Licens: CC BY-SA 2.5
Full featured double rainbow in Wrangell-St. Elias National Park, Alaska.
Forfatter/Opretter: Tango Project], Gnome, og VisualEditor team, Licens: GPL
Icon used to indicate a list

This image describes earth's energy budget.

Spectral Irradiance of Sunlight (smoothed)
Reference: http://rredc.nrel.gov/solar/spectra/am1.5/"The Blue Marble" is a famous photograph of the Earth taken on December 7, 1972, by the crew of the Apollo 17 spacecraft en route to the Moon at a distance of about 29,400 kilometres (18,300 mi). It shows Africa, Antarctica, and the Arabian Peninsula.
_2008.svg)
Global energy budget of the Earth for the period March 2000 - May 2004

Gas proportions in the Earth's atmosphere. The proportion of water vapor (H₂O) is variable so it is not represented in this chart, however it averages about 1% in the troposphere.
Vectorized version of Image:Atmosphere gas proportions.gif (originally by Brockert). I SVG'd it a) to make it more international (chemical symbols) b) to make it (hopefully) clearer when rendered as a thumbnail and c) to make it easier to modify.

It is now known that most cosmic rays are atomic nuclei. Most are hydrogen nuclei, some are helium nuclei, and the rest heavier elements. The relative abundance changes with cosmic ray energy -- the highest energy cosmic rays tend to be heavier nuclei. Although many of the low energy cosmic rays come from our Sun, the origins of the highest energy cosmic rays remains unknown and a topic of much research. This drawing illustrates air showers from very high energy cosmic rays.

Forfatter/Opretter: Oeneis, Licens: CC BY-SA 4.0
This figure shows the history of atmospheric carbon dioxide concentrations as directly measured at Mauna Loa, Hawaii since 1958. This curve is known as the Keeling curve, and is an essential piece of evidence of the man-made increases in greenhouse gases that are believed to be the cause of global warming. The longest such record exists at Mauna Loa, but these measurements have been independently confirmed at many other sites around the world [1].
The annual fluctuation in carbon dioxide is caused by seasonal variations in carbon dioxide uptake by land plants. Since many more forests are concentrated in the Northern Hemisphere, more carbon dioxide is removed from the atmosphere during Northern Hemisphere summer than Southern Hemisphere summer. This annual cycle is shown in the inset figure by taking the average concentration for each month across all measured years.
The red curve shows the average monthly concentrations, and blue curve is a smoothed trend.