Gamut

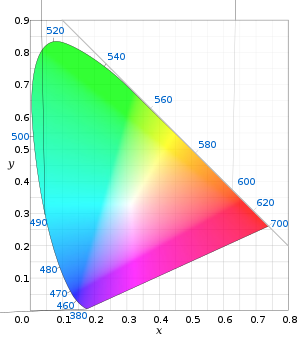
Gamut (på dansk: farvespektrum eller farveskala) betegner et givent apparats evne til at vise et gennemsnitlig menneskes måde at opfatte farver på. Inden for den grafiske branche bruges gamut til at beskrive hvordan en skærm, en printer, en skanner, et kamera eller en trykkerimaskine frembringer farver i forhold til hinanden, samt hvor stort et farveområde de hver især kan frembringe.
En computerskærms farverum skabes gennem addition af farver (f.eks. rød, grøn og blå) og har samtidig en fiktiv temperatur, som står for et sortlegemes nødvendige temperatur for at kunne frembringe det tilsvarende farveindtryk. Alle farver kan anvendes i sammenlægningen (additionen), men typisk anvendes farver som ligger så langt som muligt fra hinanden i menneskets gamut – og som er lysstærke set med menneskets øjne – sidst men ikke mindst skal man have noget der kan lave farven effektivt; f.eks. lysdioder, lysstofrørs fosforfarver eller laserstråler.
En printer og trykkerimaskine farver dannes gennem subtraktion af farvekurver (f.eks. cyan, magenta, gul og ofte sort). Med subtraktive farver menes farver dannet under belysning med hvidligt lysindtryk og filtreret efter refleksion af farvepigmenter. Farvepigmenters lysfilterfunktion danner farven ved at absorbere alt synligt lys, undtagen pigmentets farvekurve.
Det er ikke muligt frembringe farver fra hele det menneske synlige farvespektrum fra nogen af disse maskiner, og gamut er ofte forskudt i forhold til hinanden. Printeren kan eksempelvis være stærk i de rødlige nuancer hvor skærmen er stærkest i de blå.
Se også
Eksterne henvisninger
Medier brugt på denne side
(c) I, Sakurambo, CC BY-SA 3.0
Illustration of the CIE 1931 color space. This is a vectorized version of Image:CIExy1931.png by User:PAR. The spectral colours are embedded as a JPEG raster image with SVG blur applied to allow scaling to any size. From the description of Image:CIExy1931.png:
The colors for this diagram were generated using the RGB color space in en:Adobe photoshop. The transformation from xy chromaticity coordinates was done using the en:sRGB color space specification on the [X,Y,Z]=[x,y,1-x-y] tristimulus values, then multiplying by a constant so that one of the R, G, or B values was maximized. Assuming that one's monitor converts Adobe photoshop RGB according to the sRGB color space (probably a good assumption) then, within the sRGB gamut, the chromaticities are correct, but are incorrect outside the gamut. (See the sRGB article for a description of the sRGB gamut). The process of maximizing the value of R, G, or B results in a distinct 3-pointed star in the diagram, centered at the D65 white point. This is because, although the chromaticities are correct, the luminosities (brightness values) are not equal across the diagram. If the luminosities were all made equal, then the entire diagram would be rather dark, since pure blue has a low luminosity. Any attempt to equalize luminosity to remove the star will reduce the overall luminosity of the diagram, and the star will not completely disappear until the diagram is very dark. Alternatively, we could blur the colors to get rid of the star, which would give incorrect chromaticities. I have opted for correct chromaticities at maximum brightness, thus the presence of the star.


