Drivhusgas


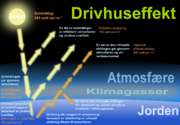
En drivhusgas har evnen til at opfange og udsende (en del af) den langbølgede varmestråling, mens den tillader størstedelen af den kortbølgede varmestråling at passere. Drivhusgasserne tillader derfor solens lys at passere atmosfæren, men opfanger Jordens varmeudstråling og returnerer en del af den. Drivhusgasserne i atmosfæren har således afgørende betydning for den gennemsnitlige temperatur.
Med drivhusgasser i atmosfæren er Jordens gennemsnitstemperatur på 14 °C. Uden drivhusgasser i atmosfæren antages at Jordens gennemsnitstemperatur ville være −18 °C.[1][2]
Drivhusgasserne
Den største og vigtigste drivhusgas, men samtidig en varierende bestanddel af den normale atmosfære er:
- Vanddamp (H2O)
De vigtigste tørre drivhusgasser er:
- Kultveilte eller kuldioxid (CO2, carbon dioxide)
- Metan (CH4, methane)
- Lattergas (N2O, nitrous oxide)
- CFC-gasser (freongasser, CFC-12 og CFC-11)
Drivhusgassernes fysik
- Langbølget betyder i denne sammenhæng stråling med en bølgelængde på 3 til 100 µm (mikrometer).
- Kortbølget betyder i denne sammenhæng stråling med en bølgelængde på ca. 290 til 3000 nm (nanometer).
Til en sammenligning omfatter det synlige lys ca 350 til 700 nm. Omtrent 99% af solens energi ligger indenfor et spektralområde på mellem 290 og 1400 nm, maksimum af indstrålingsintensitet ligger ved 474 nm (svarende til en grøngul farve). Måles den af jorden og dens atmosfære udsendte varmestråling der når ud til verdensrummet, så ligger dette maksimum ved omtrent 10 µm.
Sættes den af solen ankomne stråling ved atmosfærens yderkant til 100, så opfanger jordens overflade 50% deraf og udsender kun 6% af de 100% (altså 12% af de 50%) uhindret igennem atmosfæren og ud i verdensrummet, hvilket skyldes drivhusgassernes evne til at opfange varmestrålingen.
Global opvarmning
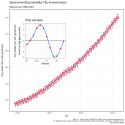
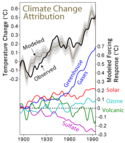
Der er opdaget en stigning i koncentrationen af drivhusgasserne i atmosfæren. Denne stigning er begyndt for omkring 300 år siden med den industrielle tidsalder, specielt med den stigende afbrænding af de fossile brændstoffer, se diagrammerne. Da drivhusgasserne opfanger varmestråling, øges dermed den tørre drivhuseffekt. Denne menneskeskabte drivhuseffekt anses for at medføre en global opvarmning.
For at mildne den forventede globale opvarmning forsøges at bringe udslippene af drivhusgasserne ned gennem politiske tiltag, såsom Kyotoprotokollen og 2020 målene. At bringe balancen tilbage til den før-industrielle tilstand er en stor videnskabelig og teknologisk udfordring.[3]
Se også
Referencer
- ^ "Solar Radiation and the Earth's Energy Balance". Arkiveret fra originalen 15. november 2019. Hentet 31. marts 2020.
{{cite web}}: Teksten "publisher" ignoreret (hjælp) - ^ "Intergovernmental Panel on Climate Change Fourth Assessment Report. Chapter 1, page 97" (PDF). Arkiveret (PDF) fra originalen 19. december 2019. Hentet 31. marts 2020.
- ^ "Changing Earth: 7 Ideas to Geoengineer Our Planet. Livescience". Arkiveret fra originalen 20. april 2014. Hentet 20. april 2014.
Eksterne henvisninger
- Center for Permafrost - Københavns Universitet Arkiveret 25. april 2012 hos Wayback Machine
Medier brugt på denne side
Forfatter/Opretter: Vinny Burgoo, Licens: CC BY-SA 3.0
Cumulative per capita responsibility for anthropogenic CO2
Data from the World Resources Institute's CAIT 4.0 database (registration required). Includes CO2 emitted up to the year 2000 only (not CH4, N20, PFCs, HFCs or SF6). Estimates of the effects of land-use change are included; bunker-fuel emissions are not. The scale is a 0-100 decay-weighted index.
The land-use estimates include the following (list from the relevant CAIT data note):
- Clearing of natural ecosystems for permanent croplands (cultivation)
- Clearing of natural ecosystems for permanent pastures (no cultivation)
- Abandonment of croplands and pastures with subsequent recovery of carbon stocks to
those of the original ecosystem
- Shifting cultivation (swidden agriculture) (repeated clearing, abandonment, and reclearing
of forests in many tropical regions)
- Wood harvest (industrial wood as well as fuel wood) - it is important to note that these
estimates include the emissions of carbon from wood products (burned, stored in longterm pools, decayed over time)
- For the U.S. only, management of wildfires and woody encroachment
Also from the CAIT data note: "It is also important to note that the calculated flux of carbon does not explicitly include changes in carbon stocks that may result from various forms of management. Examples of what is not included are agricultural intensification, fertilization, the trend to no-till agriculture, thinning of forests, changes in species or varieties, and other silvicultural practices."
And the data note warns that "these estimates of national sources and sinks of carbon from land-use change are uncertain on the order of +/- 150% for large fluxes, and +/- 50 MtC/yr for estimates near zero."
So CAIT's land-use estimates are a bit wild. They are, however, the best currently available at a national level.Evolution over time of the contents of the Earth's atmosphere of 4 greenhouse gases ; This image is a work of the National Oceanic and Atmospheric Administration, taken or made during the course of an employee's official duties. As works of the U.S. federal government, all NOAA images are in the public domain
Forfatter/Opretter: Femkemilene, Licens: CC BY-SA 4.0
The five components of the climate system.
The figure is made using Visme, with all photos from unsplash, which has a free to use copyright. Higher quality unfortunately only available with paid version.
Specifically on https://unsplash.com/license: All photos published on Unsplash can be used for free. You can use them for commercial and noncommercial purposes. You do not need to ask permission from or provide credit to the photographer or Unsplash, although it is appreciated when possible.
More precisely, Unsplash grants you an irrevocable, nonexclusive, worldwide copyright license to download, copy, modify, distribute, perform, and use photos from Unsplash for free, including for commercial purposes, without permission from or attributing the photographer or Unsplash. This license does not include the right to compile photos from Unsplash to replicate a similar or competing service.Forfatter/Opretter: Finn Bjørklid, Licens: CC BY-SA 3.0
Diagram shows how the greenhouse effect works. Norwegian text. Translation of "The green house effect.svg" on Commons
Forfatter/Opretter: Oeneis, translation by Dymetrios, Licens: CC BY-SA 4.0
This figure shows the history of atmospheric carbon dioxide concentrations as directly measured at Mauna Loa, Hawaii since 1958. This curve is known as the Keeling curve, and is an essential piece of evidence of the man-made increases in greenhouse gases that are believed to be the cause of global warming. The longest such record exists at Mauna Loa, but these measurements have been independently confirmed at many other sites around the world [1]. The annual fluctuation in carbon dioxide is caused by seasonal variations in carbon dioxide uptake by land plants. Since many more forests are concentrated in the Northern Hemisphere, more carbon dioxide is removed from the atmosphere during Northern Hemisphere summer than Southern Hemisphere summer. This annual cycle is shown in the inset figure by taking the average concentration for each month across all measured years. The red curve shows the average monthly concentrations, and blue curve is a smoothed trend. The carbon dioxide data is measured as the mole fraction in dry air. This dataset constitutes the longest record of direct measurements of CO2 in the atmosphere (data up to december 2018).
Forfatter/Opretter: Robert A. Rohde, Licens: CC BY-SA 3.0
See extending Description below
Forfatter/Opretter: Robert A. Rohde (Dragons flight at engelsk Wikipedia), Licens: GFDL 1.2
This figure is a simplified, schematic representation of the flows of energy between space, the atmosphere, and the Earth's surface, and shows how these flows combine to trap heat near the surface and create the greenhouse effect. Energy exchanges are expressed in watts per square meter (W/m2).
Data is from 2007 CERES satellite instruments, and specifically this diagram


