Antarktis’ iskappe


Antarktis’ iskappe eller den antarktiske indlandsis er en af jordens to iskapper. Den dækker et areal på næsten 14 millioner km2 eller 98% af det antarktiske kontinent med en tykkelse på op til 4775 m.
Antarktis’ iskappe er den største samlede ismængde på Jorden. Den indeholder 26,5 millioner km3 is svarende til 61% af al Jordens ferskvand. Hvis al isen i den antarktiske iskappe smeltede, ville det svare til en havniveaustigning på 61,1-70 meter.[1][2] Det antarktiske bidrag til havniveaustigningen siden 1992 udgør omkring 8 mm.[3]
I Østantarktis hviler iskappen på et stort landområde, men i Vestantarktis rækker isen ned til en dybde på mere end 2.500 m under havets overflade.
Historisk
Antarktis' iskappe dannelse startede mellem Eocæn og Oligocæn, da Antarktis blev en isoleret kontinentalplade med plads til den Antarktiske cirkumpolare havstrøm, og da atmosfærens CO2 indhold faldt drastisk, hvilket bl.a. forårsagede at temperaturen faldt. Østantarktis’ iskappe stammer tilbage fra 34 millioner år siden. Vestantarktis’ iskappe er betydelig yngre, 14 millioner år.[3]
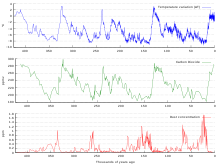
Ved undersøgelse af udborede iskerner af indlandsisen kan man få oplysninger om klimaet på det tidspunkt hvor sneen faldt, og man har hidtil ved hjælp af iskerner kunnet analysere Jordens klima. EPICA Dome C-iskernen har tilladt en kontinuert analyse af klimaet over de sidste 800.000 år.[4][5]
I den sidste mellemistid for omkring 120.000 år siden smeltede en del af Antarktis’ iskappe, og den globale vandstand steg 10m over det nuværende niveau.[6]
Antarktis’ gletsjere
Vestantarktis:
- Larsen A, Larsen B, Larsen C og Larsen D (ligger på den Antarktiske halvø)
- Pine Island Glacier [7]
- Thwaites Gletsjer, “the doomsday glacier”[7]
Subglaciale søer
Der er fundet mere end 400 isdækkede søer i Antarktis’ is.
Vostoksøen (en. Lake Vostok) den største isdækkede sø på Jorden og blev opdaget først. Den dækker et areal på omkring 12.500 kvadratkilometer og har formentlig været isoleret fra omverdenen i mindst 20 millioner år, måske meget mere, men ikke dækket af is hele tiden. I midten af søen findes en forhøjning, der indebærer at søen indeholder to forskellige miljøer.
Intet andet sømiljø indeholder så meget ilt, og det anses for givet at der findes liv i søen i form af ekstremofile mikrober der opretholder livet ved kemosyntese.
Mercer-søen (en. Lake Mercer) er en antarktisk subglacial sø med spor af fauna og flora. [8][9][10]
Whillans-søen (en. Lake Whillans) under 800 meters is er blevet undersøgt med et varmtvandsbor og der er fundet i tusindvis af mikrober: levende bakterier og arkæer.[11]
Ellsworth-søen (en. Lake Ellsworth) er en subglacial sø under 3,4 km is, der var det første forsøg på at bore igennem med et varmtvandsbor, men det lykkedes ikke at få taget en prøve af søens vand.
Untersee-søen (en. Lake Untersee) er meget speciel. Den er altid dækket af nogle meter is. Den dækker cirka 11 kvadratkilometer og er nogle steder basisk og ætsende som lud. Den indeholder store mængder metan og er mættet med ilt, og man har fundet flere meget specielle ekstremofile fotosyntetiske bakterier i søbunden og stromatolitter[12].[13]
Se også
- Grønlands indlandsis
- Ernest Shackleton
- Indlandsis
- Iskappe
- Isshelf eller isbræmme
- Larsen (iskappe)
- Mount Erebus
Eksterne links
- ^ "Rapport fra Intergovernmental Panel of Climate Change". Arkiveret fra originalen 10. juni 2012. Hentet 27. april 2021.
- ^ "Ice Sheets in Antarctica. British Antarctic Survey". Arkiveret fra originalen 9. januar 2014. Hentet 17. september 2020.
- ^ a b History, mass loss, structure, and dynamic behavior of the Antarctic Ice Sheet. Science 2020
- ^ The frozen continent. Science 2020
- ^ EPICA Dome C record of glacial and interglacial intensities. Quaternary Science Reviews. 2010
- ^ Scientists Study Sea Levels 125,000 Years Ago And It's a Terrifying Look at Our Future. ScienceAlert 2019
- ^ a b Antarctica's 'Doomsday Glacier' Is in Serious Danger, New Research Confirms. ScienceAlert 2020
- ^ EXCLUSIVE: Tiny animal carcasses found in buried Antarctic lake. Nature 2019
- ^ Ældgamle dyr fundet under isen i Antarktis. Videnskab.dk 2019
- ^ Forskere borer hul til mystisk sø under isen på Antarktis. DR Viden 2019
- ^ Lakes under the ice: Antarctica’s secret garden. Nature 2014
- ^ Anaerobic psychrophiles from Lake Zub and Lake Untersee, Antarctica. NASA 2009
- ^ Discovery of large conical stromatolites in Lake Untersee, Antarctica. Geobiologi 2011
Koordinater: 90°S 0°Ø / 90°S 0°Ø
Medier brugt på denne side
Forfatter/Opretter: Robert A. Rohde, Licens: CC BY-SA 3.0


This figure shows climate change over the last 65 million years. The data are based on a compilation of oxygen isotope measurements (δ18O) on benthic foraminifera by Zachos et al. (2001) which reflect a combination of local temperature changes in their environment and changes in the isotopic composition of sea water associated with the growth and retreat of continental ice sheets.
Because it is related to both factors, it is not possible to uniquely tie these measurements to temperature without additional constraints. For the most recent data, an approximate relationship to temperature can be made by observing that the oxygen isotope measurements of Lisiecki and Raymo (2005) are tightly correlated to temperature changes at Vostok as established by Petit et al. (1999). Present day is indicated as 0. For the oldest part of the record, when temperatures were much warmer than today, it is possible to estimate temperature changes in the polar oceans (where these measurements were made) based on the observation that no significant ice sheets existed and hence all fluctuation in (δ18O) must result from local temperature changes (as reported by Zachos et al.).
The intermediate portion of the record is dominated by large fluctuations in the mass of the Antarctic ice sheet, which first nucleates approximately 34 million years ago, then partially dissipates around 25 million years ago, before re-expanding towards its present state 13 million years ago. These fluctuations make it impossible to constrain temperature changes without additional controls.
Significant growth of ice sheets did not begin in Greenland and North America until approximately 3 million years ago, following the formation of the Isthmus of Panama by continental drift. This ushered in an era of rapidly cycling glacials and interglacials (see figure at upper right).
Also appearing on this graph are the Eocene Climatic Optimum, an extended period of very warm temperatures, and the Paleocene-Eocene Thermal Maximum (labeled PETM). The PETM is very short lived high temperature excursion possibly associated with the destablization of methane clathrates and the rapid buildup of greenhouse gases in the atmosphere. Due to the coarse sampling and averaging involved in this record, it is likely that the full magnitude of the PETM is underestimated by a factor of 2-4 times its apparent height.Forfatter/Opretter:
مخطّطٌ يُبيّن علاقة ثاني أوكسيد الكاربون ودرجة الحرارة وتركيز الغبار في قالب جليد فوستوك (بالإنجليزيّة: Vostok ice core) خلال 450,000 سنة الماضيّة
Antarctica's major ice shelf areas: These ice shelf areas can easily be seen in NSIDC's Mosaic of Antarctica. Filchner-Ronne Ice Shelf (blue) and Ross Ice Shelf (red)
These animations shows the motion of ice in Antarctica as measured by satellite data from the Canadian Space Agency, the Japanese Space Agency and the European Space Agency, and processed via NASA-funded research from the University of California, Irvine. The background image from the Landsat satellite is progressively replaced by a map of ice velocity, which is colour-coded on a logarithmic scale.
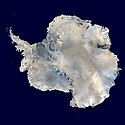
Antarctica. An orthographic projection of NASA's Blue Marble data set (1 km resolution global satellite composite). "MODIS observations of polar sea ice were combined with observations of Antarctica made by the National Oceanic and Atmospheric Administration’s AVHRR sensor—the Advanced Very High Resolution Radiometer." Image was generated using a custom C program for handling the Blue Marble files, with orthographic projection formulas from MathWorld.
Note: this image has been manually modified to fill in an area of black pixels in the ocean, in the upper right quadrant. The black pixels are presumed to be due to missing data in the land/sea mask used in making the original Blue Marble image.
Transantarctic Mountains, West Antarctica, East Antarctica


