US timeline. Opioid deaths

Forfatter/Opretter:
National Institute on Drug Abuse. On some versions of the chart freeware IrfanView was used to crop out the outer white space. And/or edit text at the top, and add a border. See Commons:Convert tables and charts to wiki code or image files, and the section about adding and editing text on chart images.
Kredit:
Overdose Death Rates. By National Institute on Drug Abuse (NIDA). Click images there to enlarge, and then right-click and "open image in new tab". 1999-2021 chart. 1999-2019 chart. 1999-2017 chart from PDF with larger version of chart. 2002-2017 chart. 2002-2015 chart.
Shortlink:
kilde:
størrelse:
1200 x 900 Pixel (183055 Bytes)
beskrivelse:
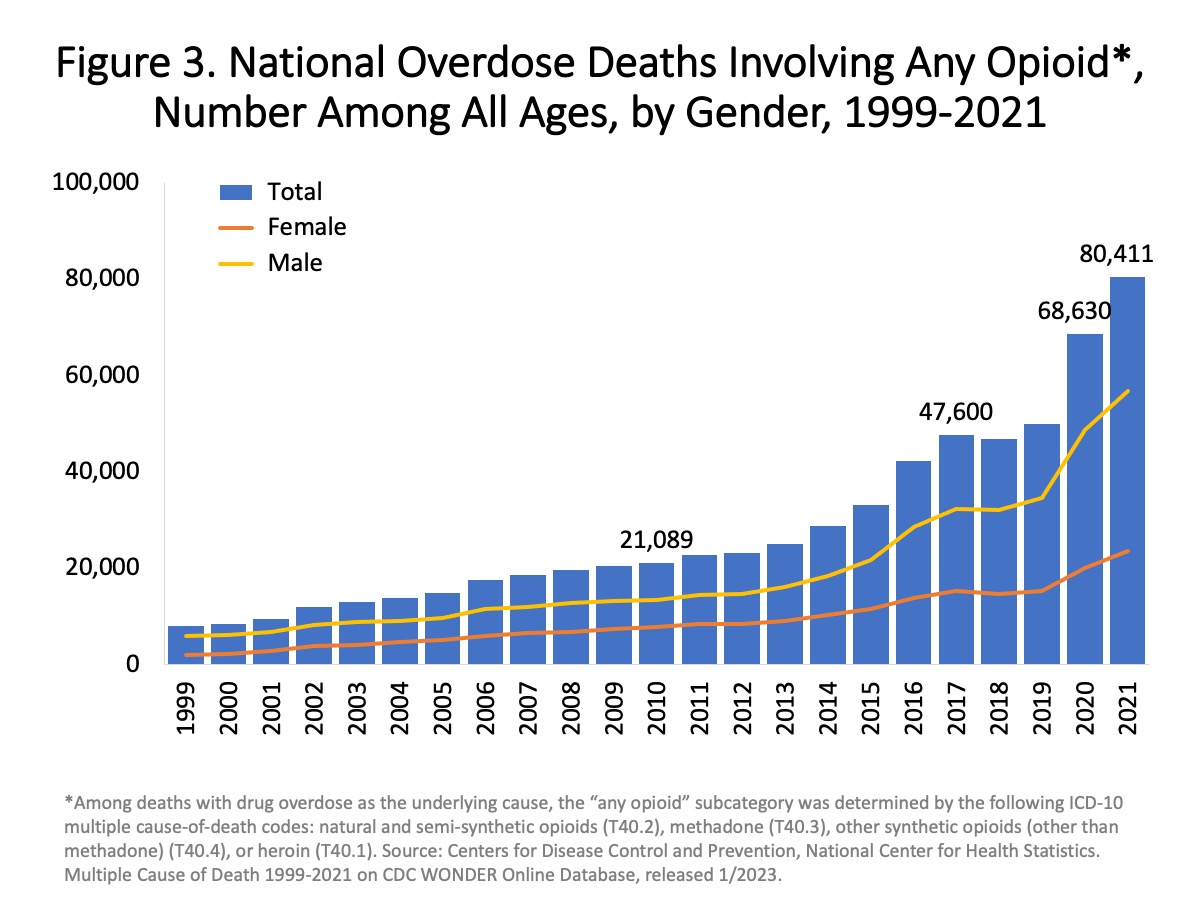
From source (emphasis and links added): "Figure 3. National Overdose Deaths Involving Any Opioid—Number Among All Ages, by Gender, 1999-2021. The figure above is a bar and line graph showing the total number of U.S. overdose deaths involving any opioid from 1999 to 2021. Any opioid includes prescription opioids (natural and semi-synthetic opioids and methadone), heroin, and synthetic opioids other than methadone (primarily fentanyl)). Opioid-involved overdose deaths rose from 21,089 in 2010 to 47,600 in 2017 and remained steady through 2019. This was followed by a significant increase in 2020 with 68,630 reported deaths and again in 2021 with 80,411 reported overdose deaths. The bars are overlaid by lines showing the number of deaths by gender from 1999 to 2021 (Source: CDC WONDER).
Licens:
Public domain
Yderligere oplysninger om licens til billedet kan findes her. Sidste ændring: Sun, 14 Apr 2024 06:23:13 GMT