LogisticMap BifurcationDiagram


Forfatter/Opretter:
PAR
Kredit:
Eget arbejde
størrelse:
1838 x 1300 Pixel (584270 Bytes)
beskrivelse:
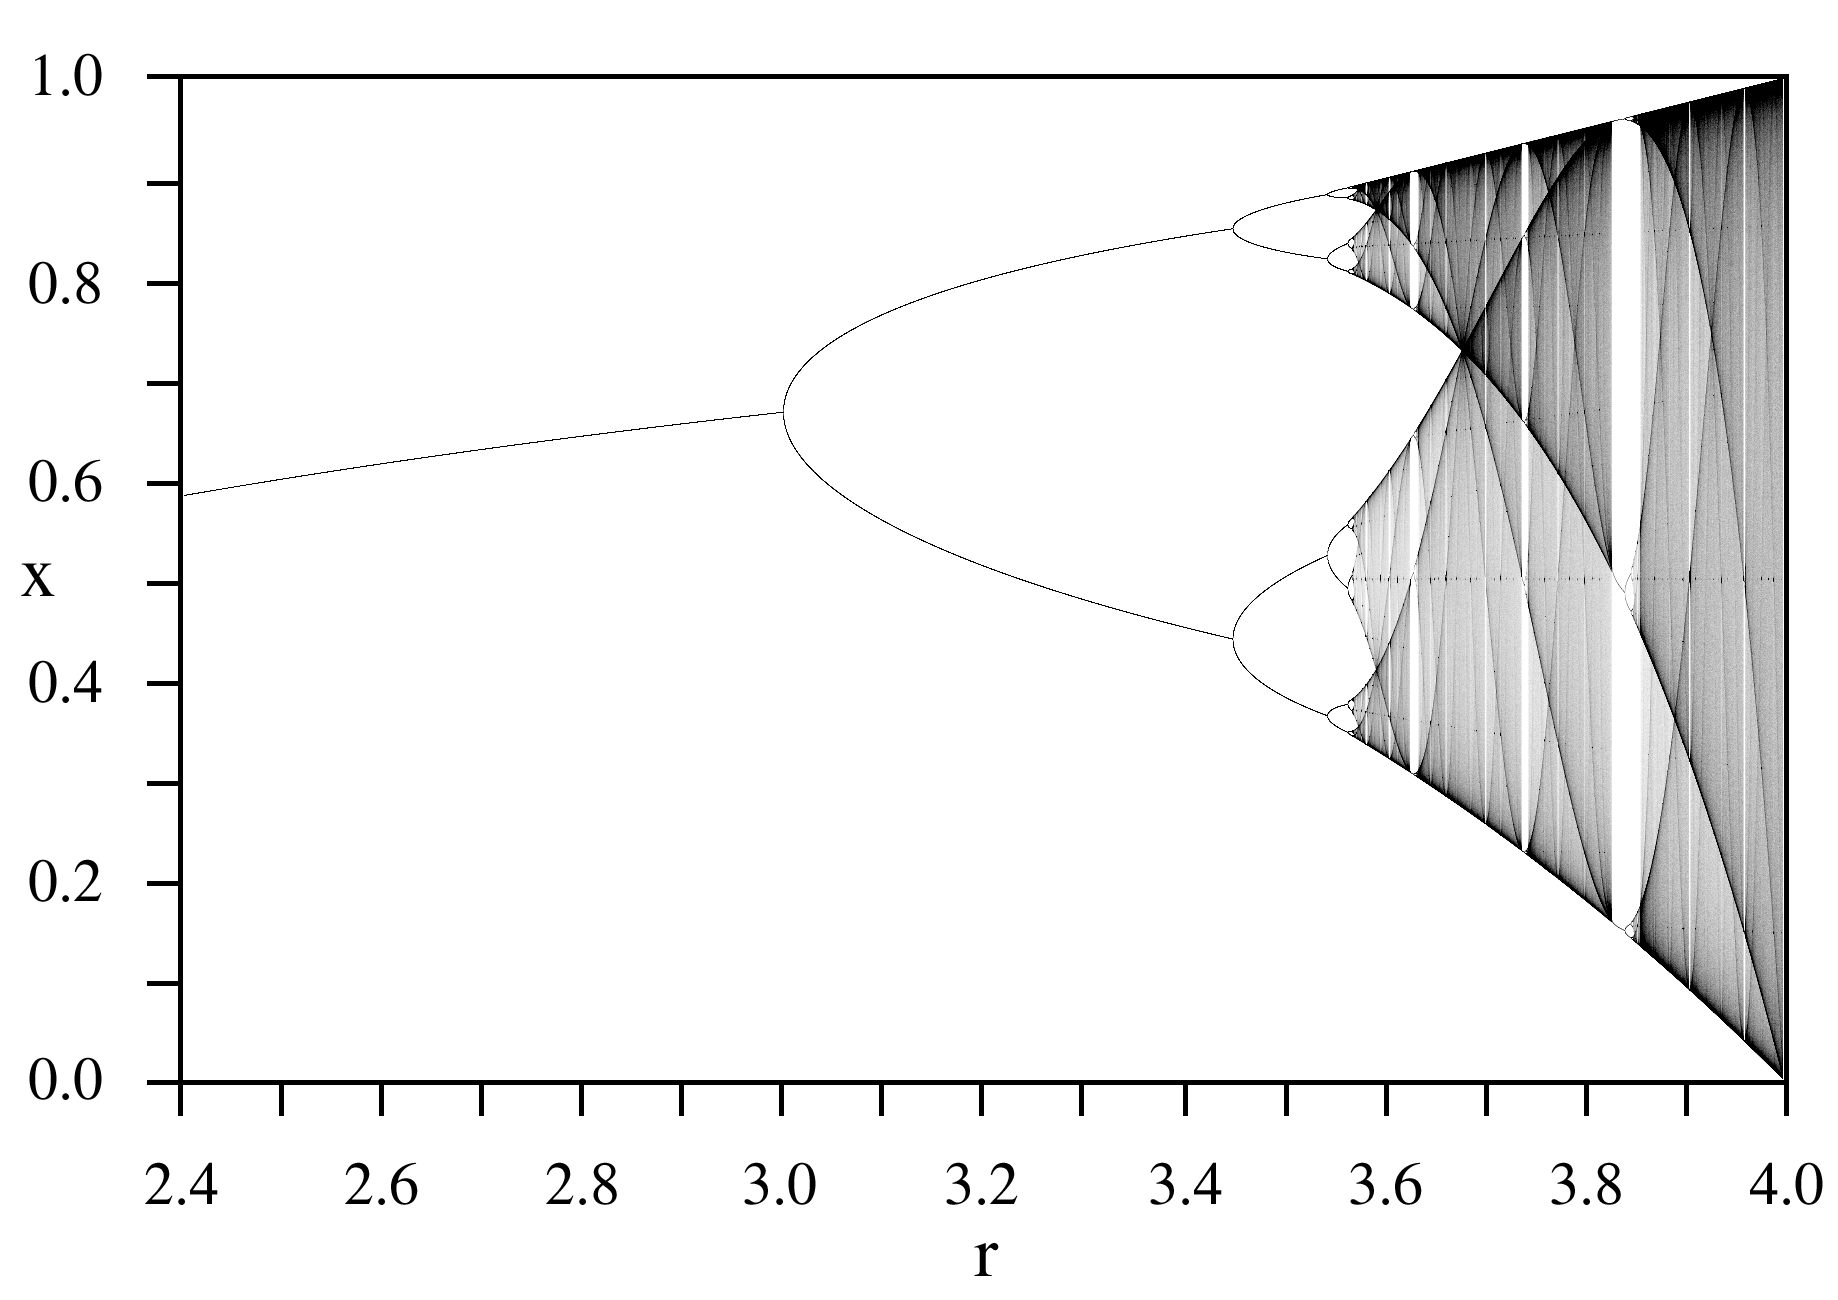
A bifurcation diagram for the Logistic map:
The horizontal axis is the r parameter, the vertical axis is the x variable. The image was created by forming a 1601 x 1001 array representing increments of 0.001 in r and x. A starting value of x=0.25 was used, and the map was iterated 1000 times in order to stabilize the values of x. 100,000 x -values were then calculated for each value of r and for each x value, the corresponding (x,r) pixel in the image was incremented by one. All values in a column (corresponding to a particular value of r) were then multiplied by the number of non-zero pixels in that column, in order to even out the intensities. Values above 250,000 were set to 250,000, and then the entire image was normalized to 0-255. Finally, pixels for values of r below 3.57 were darkened to increase visibility.
Licens:
Public domain

Yderligere oplysninger om licens til billedet kan findes her. Sidste ændring: Sun, 24 Dec 2023 14:34:51 GMT