Epica-vostok-grip-40kyr
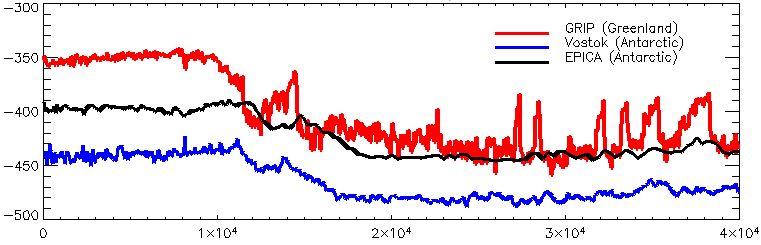
From the en:Vostok and en:EPICA (en:Antarctica) and GRIP (en:Greenland) en:ice cores: d-D and d-o-18, last 40kyr.
Horizontal axis: time before 1950 (I think). Vertical axis: d-D (or delta-O-18 * 10).
Note that d-D or d-O-18 is a en:proxy for temperature: more negative is colder; the period from 20 to 10 kyr shows the rise in temperature at the end of the last ice age. Note the en:Dansgaard-Oeschger events visible in the GRIP core but barely, if at all, in the Antarctic cores.
d-D and d-O-18 tend to be "the same" (http://www.iceandclimate.nbi.ku.dk/publications/papers/pdfs/242.pdf/) though a factor of 8 comparison would be better than 10.
Updated version of en:Image:Epica-vostok-40kyr.png including GRIP, from:
GRIP: ftp://ftp.ncdc.noaa.gov/pub/data/paleo/icecore/greenland/summit/ngrip/isotopes/ngrip-d18o-50yr.txt (ss09sea timescale)
EPICA: ftp://ftp.ncdc.noaa.gov/pub/data/paleo/icecore/antarctica/epica_domec/edc_dd.txt (EDC2 timescale)
Vostok: ftp://ftp.ncdc.noaa.gov/pub/data/paleo/icecore/antarctica/vostok/deutnat.txt (GT4 timescale)
Code:
a=readfromfile('edc_dd1.txt',col=6,ign=1)

b=readfromfile('vostok_deutnat1.txt',ign=1,col=4)

c=readfromfile('grip.txt',ign=10,col=2)

!p.multi=[0,1,2]

ep=reform(a(5,*))
vo=reform(b(2,*))
gr=reform(c(1,*))*10

plot,a(4,*),ep,title='delta-o18 vs age',/xs,xr=[0,40000],ymarg=[2,5],yr=makerange([ep,vo,gr]),th=3
oplot,col=3,b(1,*),vo,th=3
oplot,col=2,c(0,*),gr,th=3
oplot,a(4,*),ep,th=3
add_key,/rig,['EPICA (Antarctic)','Vostok (Antarctic)','GRIP (Greenland)'],[!p.color,3,2],th=3,/top
Yderligere oplysninger om licens til billedet kan findes her. Sidste ændring: Mon, 01 Apr 2024 06:15:17 GMT