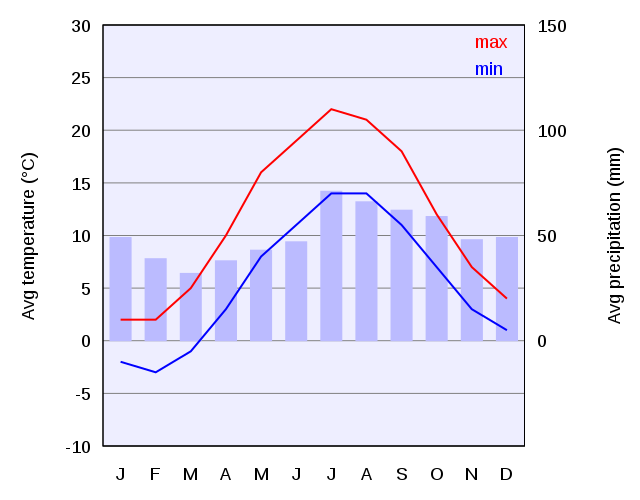
Climate chart of Copenhagen
Forfatter/Opretter:
Kredit:
Self-made in gnuplot (source). Data obtained from BBC Weather Centre.
Shortlink:
kilde:
størrelse:
640 x 500 Pixel (15069 Bytes)
beskrivelse:
A climate chart of Copenhagen, Denmark. The red line depicts daytime high; blue is nighttime low.
Licens:
Public domain
Yderligere oplysninger om licens til billedet kan findes her. Sidste ændring: Tue, 05 Mar 2024 05:40:03 GMT
