Carbon basic phase diagram
Forfatter/Opretter:
Kredit:
Own work using:
- Diagram at J.M. Zazula, On Graphite Transformations at High Temperature and Pressure Induced by Absorption of the LHC Beam, 1997 as based on:
- F.P. Bundy, Pressure-Temperature Phase Diagram of Elemental Carbons, Physica A 156, 169 (1989).
- J. Steinback et al., A Model for Pulsed Laser Melting of Graphite, J. Appl. Phys. 58 (11), 4374 (1985).
Shortlink:
kilde:
størrelse:
672 x 509 Pixel (13795 Bytes)
beskrivelse:
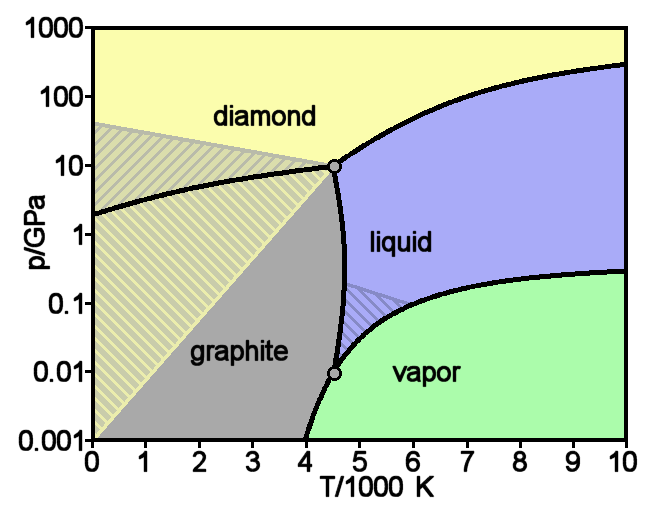
Theoretical phase diagram of carbon, which shows the state of matter for varying temperatures and pressures. The hatched regions indicate conditions under which one phase is metastable, so that two phases can coexist. The source reference says that the phase diagram is well established only up to around 100 GPa. More recent work shows that the melting point does not go as high as 10,000 K.
Accurate illustration but not a pixel-exact plot. Also note that a considerable disagreement exists between theory and experiment, e.g., for the triple point doi:10.1016/0008-6223(76)90010-5
Licens:
Public domain
Yderligere oplysninger om licens til billedet kan findes her. Sidste ændring: Wed, 06 Mar 2024 18:04:22 GMT