65 Myr Climate Change


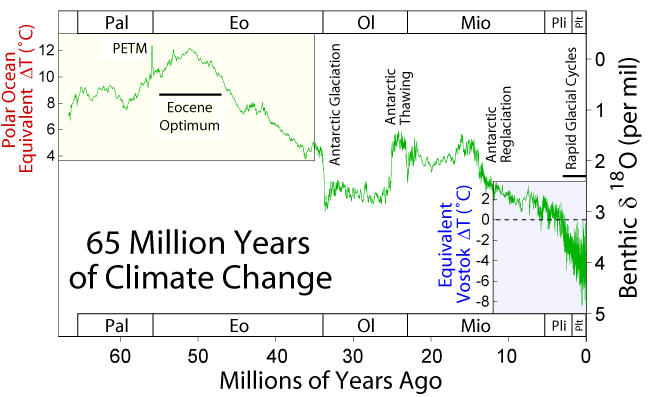
This figure shows climate change over the last 65 million years. The data are based on a compilation of oxygen isotope measurements (δ18O) on benthic foraminifera by Zachos et al. (2001) which reflect a combination of local temperature changes in their environment and changes in the isotopic composition of sea water associated with the growth and retreat of continental ice sheets.
Because it is related to both factors, it is not possible to uniquely tie these measurements to temperature without additional constraints. For the most recent data, an approximate relationship to temperature can be made by observing that the oxygen isotope measurements of Lisiecki and Raymo (2005) are tightly correlated to temperature changes at Vostok as established by Petit et al. (1999). Present day is indicated as 0. For the oldest part of the record, when temperatures were much warmer than today, it is possible to estimate temperature changes in the polar oceans (where these measurements were made) based on the observation that no significant ice sheets existed and hence all fluctuation in (δ18O) must result from local temperature changes (as reported by Zachos et al.).
The intermediate portion of the record is dominated by large fluctuations in the mass of the Antarctic ice sheet, which first nucleates approximately 34 million years ago, then partially dissipates around 25 million years ago, before re-expanding towards its present state 13 million years ago. These fluctuations make it impossible to constrain temperature changes without additional controls.
Significant growth of ice sheets did not begin in Greenland and North America until approximately 3 million years ago, following the formation of the Isthmus of Panama by continental drift. This ushered in an era of rapidly cycling glacials and interglacials (see figure at upper right).
Also appearing on this graph are the Eocene Climatic Optimum, an extended period of very warm temperatures, and the Paleocene-Eocene Thermal Maximum (labeled PETM). The PETM is very short lived high temperature excursion possibly associated with the destablization of methane clathrates and the rapid buildup of greenhouse gases in the atmosphere. Due to the coarse sampling and averaging involved in this record, it is likely that the full magnitude of the PETM is underestimated by a factor of 2-4 times its apparent height.Yderligere oplysninger om licens til billedet kan findes her. Sidste ændring: Fri, 22 Mar 2024 08:32:42 GMT
