Milankovitch Variations
Forfatter/Opretter:
This image was produced by Robert A. Rohde from publicly available data, and is incorporated into the Global Warming Art project.
Attribution:
Billedet er tagget "Attribution Required", men der blev ikke angivet nogen tilskrivningsoplysninger. Attributionsparameteren blev sandsynligvis udeladt ved brug af MediaWiki-skabelonen til CC-BY-licenserne. Forfattere og ophavsmænd finder et eksempel på korrekt brug af eksempel her. her.
Kredit:
Eget arbejde
Shortlink:
kilde:
størrelse:
479 x 363 Pixel (32939 Bytes)
beskrivelse:
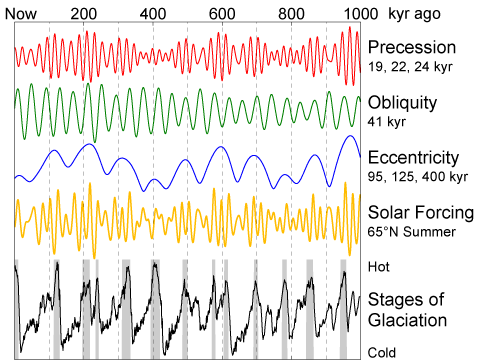
This figure shows the variations in Earth's orbit, the resulting changes in solar energy flux at high latitude, and the observed glacial cycles.
According to Milankovitch Theory, the precession of the equinoxes and the apsides, variations in the tilt of the Earth's axis (obliquity) and changes in the eccentricity of the Earth's orbit are responsible for causing the observed 100 kyr cycle in ice ages by varying the amount of sunlight received by the Earth at different times and locations, particularly high northern latitude summer. These changes in the Earth's orbit are the predictable consequence of interactions between the Earth, its moon, and the other planets.
The orbital data shown are from Quinn et al. (1991). Principal frequencies for each of the three kinds of variations are labeled. The solar forcing curve (aka "insolation") is derived from July 1st sunlight at 65 °N latitude according to Jonathan Levine's insolation calculator [1]. The glacial data are from Lisiecki and Raymo (2005) and gray bars indicate interglacial periods, defined here as deviations in the 5 kyr average of at least 0.8 standard deviations above the mean.
Licens:
Licensbetingelser:
Creative Commons Attribution-Share Alike 3.0
Yderligere oplysninger om licens til billedet kan findes her. Sidste ændring: Thu, 25 Jan 2024 12:57:28 GMT